

Waterfall connectors float when a total is plotted as another change
Updated
A waterfall chart reads each number as a change. Positive steps rise. Negative steps fall. Connector lines join the end of one bar to the start of the next. They are a single style under Customize → Chart style (color, and whether they show). They are not a per-bar switch. When a connector floats, the running base is wrong. The usual source is a last row that already contains the total, plotted in the same series as the steps. The chart adds that total on top of the steps it already summed. The last bar starts in the air, and the connector runs to it.
Gaps from #N/A in an ordinary line chart are chart error gaps. Keep the Google Sheets UI in English. Sheet Error is an independent formula-error library, not a Google product.
Recreate it on a blank sheet
Section titled “Recreate it on a blank sheet”- Open a blank spreadsheet. In A1 type
step, B1change. A2Open, B2100. A3Cost, B3-40. A4Tax, B4-10. The steps sum to50. In A5 typeEnd. In B5 enter=SUM(B2:B4). B5 is50. That50is the result of the steps, not a new step.
The chart that double-counts the end. Select A1:B5. Insert → Chart. Set Chart type to Waterfall chart (it sits under Other in the type list). On Setup, use column A as labels if the editor offers that checkbox, and leave Switch rows/columns off. You want one bar per row. The Open bar is 100. Cost drops 40. Tax drops 10. The End bar is another 50 stacked on the 50 the chart already reached, so it sits near 100 instead of on the axis at 50. The connector into End does not land on a bar that starts at zero. Leave this chart. That float is the recreate.
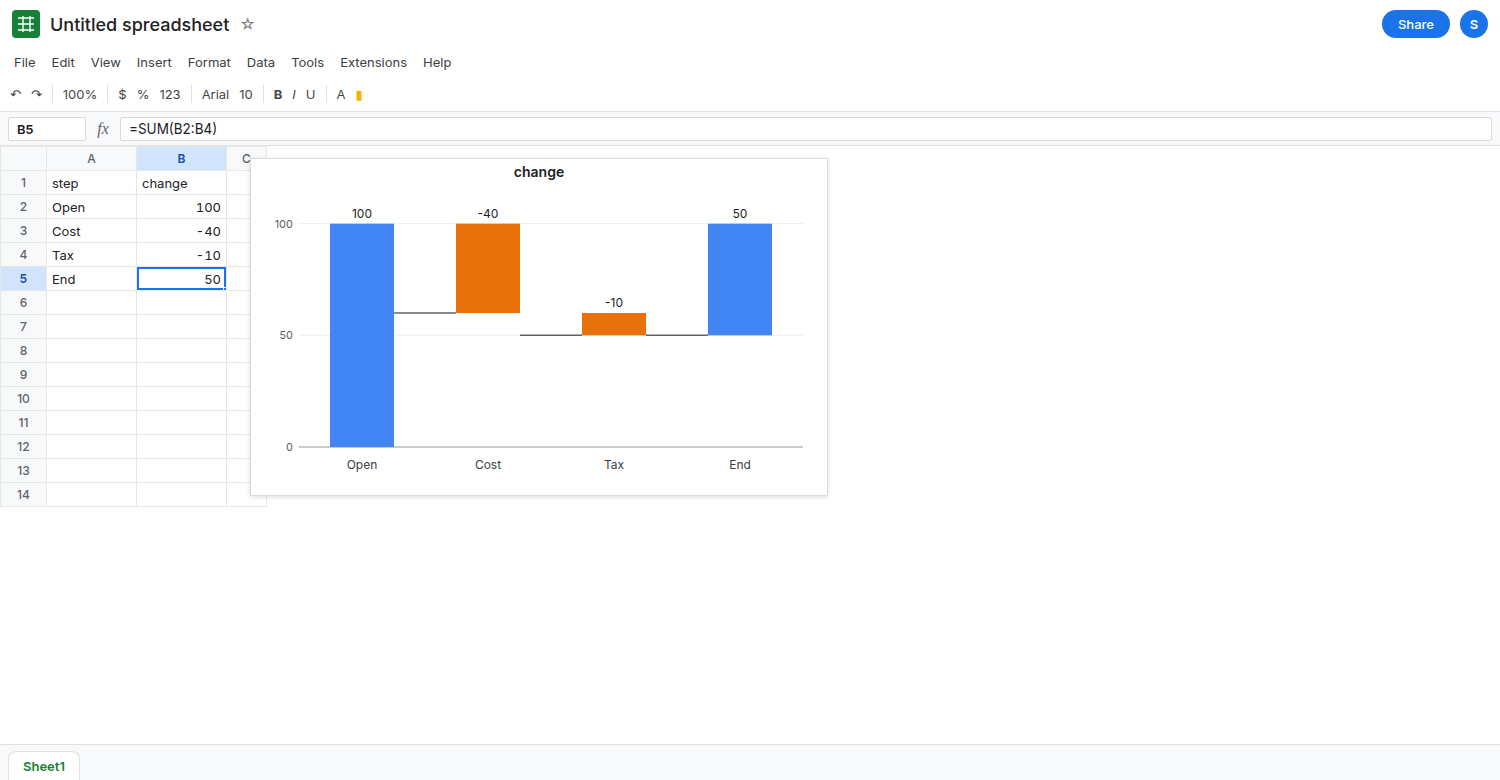
Connectors are all on or all off. Double-click the chart. Customize → Chart style. Find the connector control (wording is along the lines of connector lines, with a color). Turn them off. Every join disappears together. Turn them on. They all return. You cannot thicken only the line into End. Leave them on so the float stays visible.
A blank breaks the base the same way. In B3 enter ="". The Cost row is text, not -40. The next bars no longer step from 60. ISNUMBER(B3) is FALSE. Put B3 back to -40 after you have seen the break. A formula blank is not a zero step. See wrong type if a later formula needed the number.
Switch rows/columns is a different picture. On Setup, turn Switch rows/columns on. The chart stops being one bar per step and treats the layout as series. The connectors are not the bug. Turn the switch off again. The float from B5 returns.
What is actually wrong
Section titled “What is actually wrong”- The value column is a list of changes. B2:B4 already explain how you got from
0to50. B5 repeats50as if it were a fourth change. The waterfall adds it. The connector follows that addition. It is not a styling glitch. - Connector appearance does not set the base. Color and on/off apply to every join. A floating line is a data problem that the style control will not anchor.
- Text,
="", and a number stored as text leave a hole in the running total. The next real number starts from the wrong height.ISNUMBERon every change cell should be TRUE. Left-aligned digits are CSV text vs number. - Row order is bar order. Sorting the steps by size reorders the story and moves every connector. The chart does not keep a narrative order of its own.
This is not a pivot. A pivot total is pivot not refreshing when the source grew. Here the source total is inside the chart range on purpose.
Leave the broken chart up until the data change, so you can see End land.
Chart the changes only. Clear A5:B5, or set the chart range to A1:B4. Open 100, Cost -40, Tax -10. The last bar ends at 50 above the axis if it is still a change, and the connectors meet bar to bar. The end value is the top of the last step, not an extra row that restates the sum.
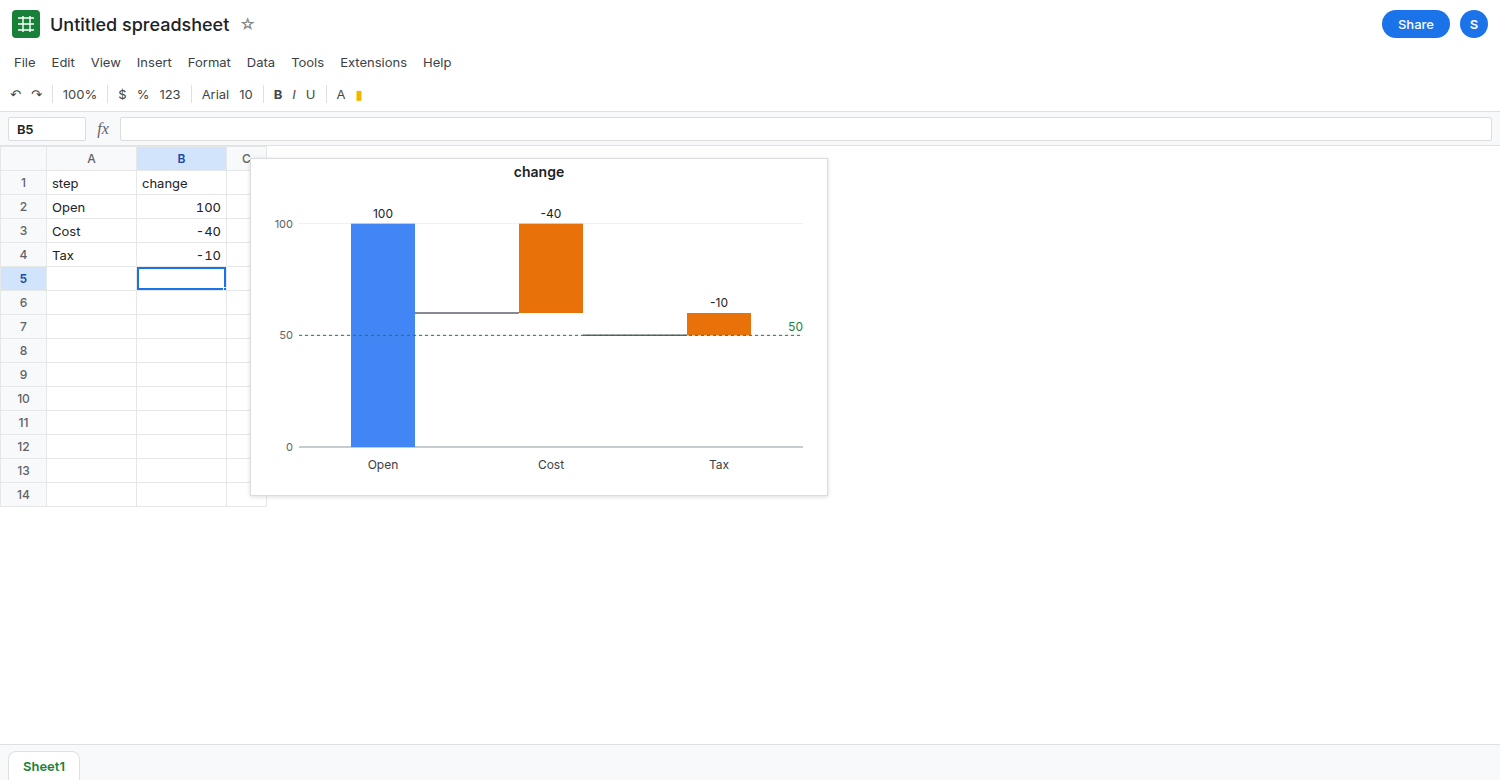
If the editor offers a total or subtotal treatment for a point, use it only on a row you intend as an absolute bar, and only after you have read what that point does to the next connector. If you do not see that control, do not hunt through Chart style. Delete the cumulative row. This page will not invent a checkbox the editor does not show.
Zeros, not blanks. A step that should change nothing is the number 0, not ="". ISNUMBER is TRUE. The connector crosses a zero-height step instead of losing the base.
Do not draw the connectors by hand with shapes. They will not follow the next edit to column B.
If the last bar floats and its cell is SUM of the rows above, take that row out of the chart range. If a connector breaks where a cell looks empty, replace the formula blank with a number. If every bar is a series instead of a step, turn Switch rows/columns off.