

IFERROR of an error with "" is not a chart gap, and IFNA does not blank the same cells
Updated
IFERROR(value, "") replaces every error with an empty string. The cell looks blank. ="" is TRUE and ISBLANK is FALSE. A line chart plots numbers. An empty string is not #N/A, and it is not an empty cell. Depending on the chart’s Plot null values setting, a real blank gaps, drops to zero, or connects across. #N/A is the value Google Sheets leaves as a gap more reliably than a zero-length string. IFNA(value, "") writes that string only for #N/A. A #DIV/0! stays #DIV/0!, and the line gaps there the way the raw error gaps. Wrapping with IFERROR and "" to “clean the series” can pull a point to zero, or skip it, in a way IFNA does not. The chart is following the cells you wrote.
Sheet Error is an independent formula-error library, not a Google product. Replacing errors with 0, and why #N/A gaps, is chart error gaps. The two wrappers on one cell are IFERROR vs IFNA. The same mask inside ARRAYFORMULA is ARRAYFORMULA IF mask. Keep the Google Sheets UI in English.
Recreate it on a blank sheet
Section titled “Recreate it on a blank sheet”- Open a blank spreadsheet. In A1 type
month, B1raw. A2Jan, B210. A3Feb. In B3 enter=10/0. B3 is#DIV/0!. A4Mar, B412. A5Apr. In B5 enter=NA(). B5 is#N/A. A6May, B68.
Chart the raw errors. Select A1:B6. Insert → Chart. Set the type to Line chart. February and April are gaps. The line does not touch zero there. In the chart editor, find Plot null values if it is shown for this chart (the line-chart choices are gaps, zero, or connect). Leave it on gaps if you can. The raw series is the control. Leave B3 and B5 broken.
IFERROR to an empty string. In C1 type iferror_blank. In C2 enter =IFERROR(B2,"") and fill C2:C6. C3 and C5 look empty. In C7 enter =ISBLANK(C3). C7 is FALSE. In C8 enter =C3="". C8 is TRUE. Chart A1:A6 with C1:C6 as a second line chart. Compare February and April to the first chart. The empty string can sit on zero, or skip, and it will not match the #DIV/0! and #N/A gaps in every setting. If your second chart still gaps, switch Plot null values to zero and back to gaps and watch C3 move when the raw #N/A does not. Leave C3 as the empty string either way.
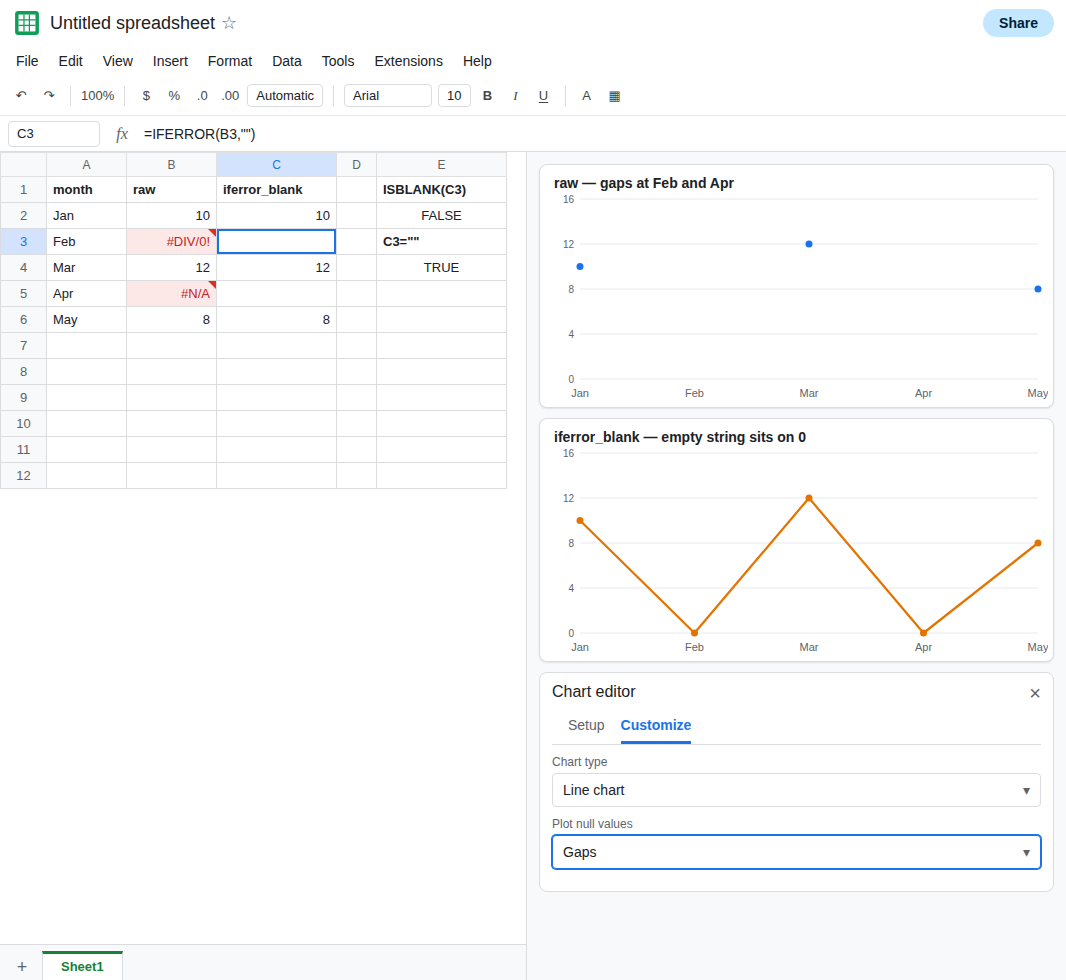
IFNA does not blank February. In D1 type ifna_blank. In D2 enter =IFNA(B2,"") and fill D2:D6. D3 stays #DIV/0!. D5 looks empty, and it is the string, same as C5. A line chart of column D gaps in February because the error is still an error, and April follows whatever the empty string did in column C. The two “blank” columns are not the same series. Leave D3 as #DIV/0!.
A true blank versus the string. Clear E3. Do not put a formula there. =ISBLANK(E3) is TRUE. =E3="" is also TRUE for a real blank in Sheets, so the equality is a weak test. ISBLANK is the one that separates E3 from C3. An omitted second argument, =IFERROR(B3), returns a blank that is closer to E3 than "" is. Check ISBLANK on that cell on your file. Do not assume it matches C3.
What is actually wrong
Section titled “What is actually wrong”""is a value. The chart receives it.#DIV/0!and#N/Aare errors. The raw chart skips them. See chart error gaps.IFERRORruns first, so the chart never sees the error you removed.IFNAis narrower. February stays a divide-by-zero. April becomes a string. If the goal was “gap on a missing point, and keep real failures visible,”IFNAplus a chart of the errors matches that goal better thanIFERRORof everything. See IFERROR vs IFNA.- Plot null values changes blanks. It is not a promise about empty strings or about
#N/A. A series that “breaks” only after you filledIFERROR(...,"")is the string, not a broken Insert menu. SUMof C3 is0because text is skipped, the same quiet zero as other text. The chart may still plot a point. Those two consumers disagree. See IF blank vs 0.- Inside
ARRAYFORMULA, the same""spills down the column andISBLANKstays FALSE on those rows. See ARRAYFORMULA IF mask.
Leave column C as the empty-string series so the chart difference stays visible.
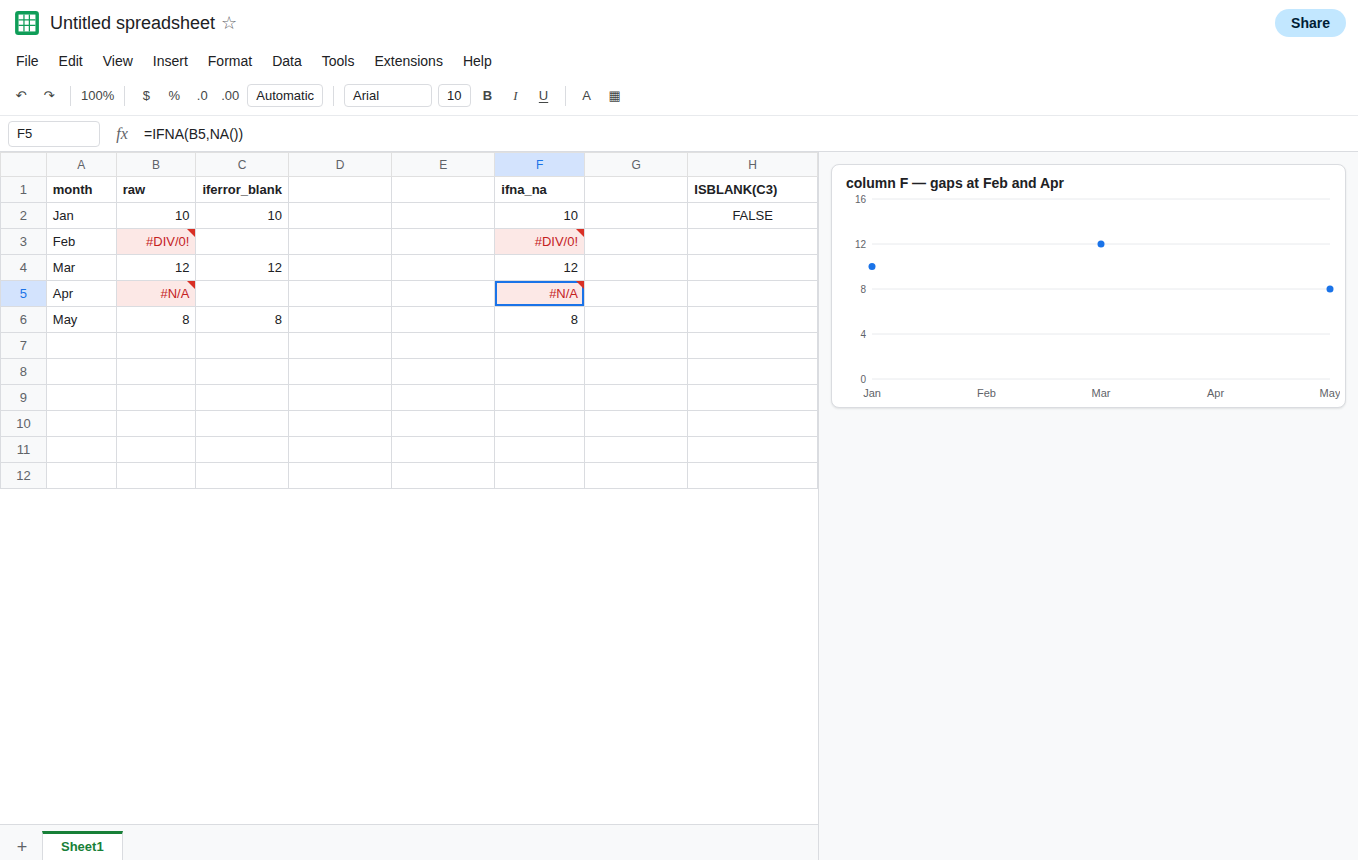
Keep a gap with NA(), and let real errors show. In F2 enter =IFNA(B2,NA()) and fill F2:F6. F3 is still #DIV/0!. F5 is #N/A. A line chart of column F gaps in April and still gaps in February, and February is an error you can read. If the missing point should be a gap and a zero divisor should be a gap too, you have chosen to hide the divisor. Prefer =IF(ISNA(B2),NA(),B2) only when you have confirmed the #N/A is a missing point and not a bug you need. See what #N/A means.
A zero is a real point. Use 0 only when the month’s units are zero. IFERROR(B3,0) plots a point on the axis. That is chart error gaps, and it is a different lie from the empty string.
If the line touches zero where the formula bar shows IFERROR and "", the chart is plotting the string you stored, not the old #DIV/0!. If IFNA left #DIV/0! and blanked only #N/A, the wrappers are doing different jobs. If ISBLANK is FALSE, you did not write a blank cell.