

FORECAST.ETS seasonality 0 drops the weekly pattern; auto can return #NUM!
Updated
FORECAST.ETS(target_date, values, timeline, seasonality, data_completion, aggregation) is an Excel forecast. seasonality chooses the cycle. 0 means no seasonality: a smoothed trend that does not repeat last week’s shape. An integer such as 7 is the length of the cycle, in the same steps as the timeline. 1, or omitting the argument, asks Excel to detect a cycle. Detection that cannot find one returns #NUM!. A 0 on the same weekly history returns a number. That number is not an error, and it is the wrong model when the history spikes on the same weekday every week.
Google Sheets does not have FORECAST.ETS. The formula is #NAME? there. Sheets’ straight line is FORECAST / FORECAST.LINEAR, whose x and y ranges still have to be the same length. That length rule is FORECAST length. An unknown function name is unknown function. Keep the Google Sheets UI in English when you open the file in Sheets. Sheet Error is not Microsoft and not Google.
Recreate it on a blank sheet
Section titled “Recreate it on a blank sheet”- Use Excel for the seasonality argument. You will open the same cells in Google Sheets at the end for the
#NAME?. In Excel, in A1 typeday, B1qty. Put days1through14in A2:A15. This timeline steps by1. In B2:B15 put a weekly shape:10for six days, then40on day7, then10for six days, then40on day14. So B2:B7 is10,10,10,10,10,10,40and B8:B15 repeats that. The spike is every seventh point.
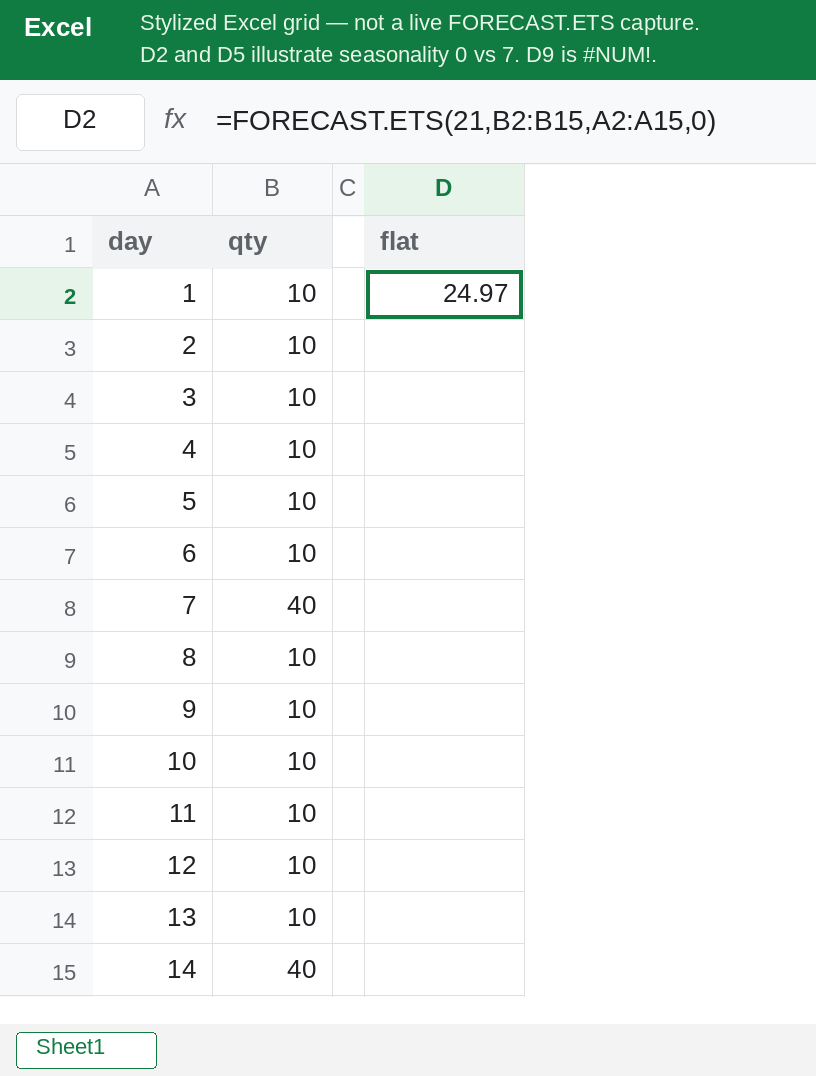
Seasonality 0 ignores the spike. In D1 type flat. In D2 enter =FORECAST.ETS(21,B2:B15,A2:A15,0). The target day is 21, which is the same weekday as day 7 and day 14 if you keep stepping by one (day 21 is another spike day: 7, 14, 21). D2 returns a number. It does not return #NUM! and it does not return #N/A. Compare it with the history: days 7 and 14 are 40, and the other days are 10. D2 will not be 40 just because the target lands on that weekday. Seasonality 0 fitted a trend through all fourteen points and did not reserve a weekly bump. Leave D2 as that number. Write it down. The bug is the missing cycle, not a triangle.
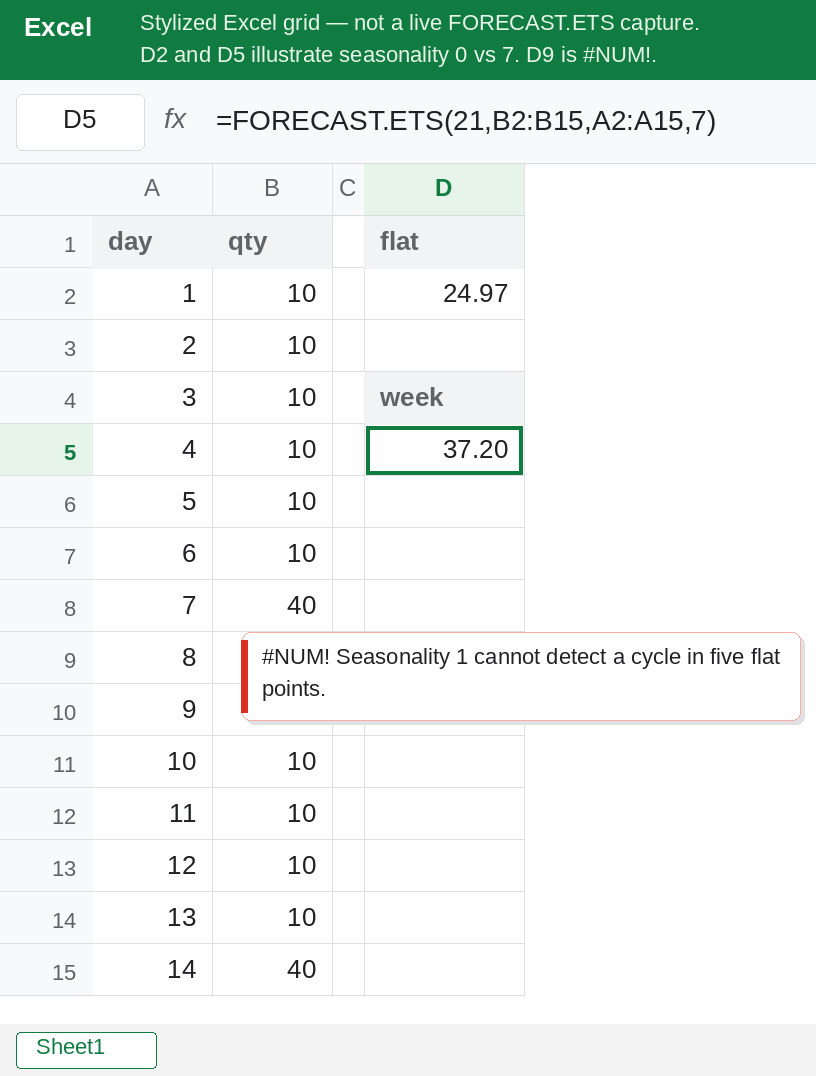
Seasonality 7 keeps the week. In D4 type week. In D5 enter =FORECAST.ETS(21,B2:B15,A2:A15,7). D5 is a number, and it is not D2. The fifth argument was omitted, so data completion stays at the default. The only change is 7 instead of 0. Day 21 is one full cycle past day 14, and day 14 was the spike. D5 sits toward that spike. D2 does not. You do not need them to equal 40. You need them to disagree, and you need D5 to be the one that still knows about day 7 and day 14. Leave both numbers up.
Automatic detection. In D7 enter =FORECAST.ETS(21,B2:B15,A2:A15,1). 1 means detect. On this fourteen-day wave, Excel can see a length of 7, and D7 is in the same neighborhood as D5, not D2. Now cut the history short. In D9 enter =FORECAST.ETS(21,B2:B6,A2:A6,1). Five points, all 10, and a request to detect a season. D9 is #NUM!. There is no cycle in five identical points, and there are not enough points to support one. Leave D9 broken. In D11 enter =FORECAST.ETS(21,B2:B6,A2:A6,0). Seasonality 0 on that same short flat history returns a number near 10, not #NUM!. The 0 did not “fail more gently.” It answered a different question.
A season longer than the history. In D13 enter =FORECAST.ETS(21,B2:B6,A2:A6,7). Five points cannot carry a cycle of length 7. Excel returns #NUM!. Leave D13 broken. A weekly argument needs the two full weeks in D5, not five flat days. If one Excel build returns a number here anyway, do not publish it as a weekly forecast.
The same formula in Google Sheets. Open the file in Sheets, or type D2’s formula on a blank Google Sheet. The cell is #NAME?. FORECAST.ETS is not a Sheets function. =FORECAST(21,B2:B15,A2:A15) is a straight line through the points, which also will not reserve a weekly spike, and it requires one y per x. See FORECAST length.
Leave D2 and D5 as two different numbers. Leave D9 as #NUM!.
What is actually wrong
Section titled “What is actually wrong”0is a legal seasonality. It means “do not model a cycle.” The forecast is a number. On this sheet it treats the two40s as bumps in a trend, not as the next day-7. D2 versus D5.7is “the pattern repeats every seven timeline steps,” not “seven days” in the abstract. The timeline has to step evenly. A missing day in column A, or a weekend removed so the step is sometimes1and sometimes3, is its own#NUM!even when the seasonality integer is right.1detects. Detection needs enough history to see the cycle more than once. Five flat points are#NUM!. Fourteen points of a clear weekly spike are not. D9 versus D7.- A seasonality integer greater than or equal to the number of points, or outside
0through8760, is#NUM!. D13. Passing7because the business is weekly does not help a five-row range. - Argument order is target, values, timeline, then seasonality. Swapping values and timeline builds the model on the wrong axis and can be
#VALUE!or a nonsense number. Count the arguments before you change0to7. - In Google Sheets the function is
#NAME?before any seasonality is considered. A Sheets cell will not confirm that0and7disagree.
This is not LINEST layout. LINEST fits a straight line and spills coefficients. FORECAST.ETS returns one forecast. A seasonal question does not get answered by reading r².
Leave D9 as #NUM! so the failed detection stays visible. Leave D2 next to D5.
Weekly history, length 7. Use D5: =FORECAST.ETS(21,B2:B15,A2:A15,7). Keep at least two full weeks in the timeline. Do not pass 0 because a sample on the internet omitted seasonality and you want the argument gone. Omitted seasonality is automatic (1), not 0. 0 is the switch that deletes the cycle.
No cycle, on purpose. Keep D2 only when a weekday spike should not repeat. Label the cell no seasonality so the next edit does not compare it to last Monday’s 40 and call Excel wrong.
Sheets. Do not paste FORECAST.ETS into Google Sheets and wrap it in IFERROR. The #NAME? is the missing function. Use FORECAST for a straight line, or keep this workbook in Excel. See unknown function.
If 0 and 7 return the same number, the history has no weekly spike to preserve. Put the pattern back in column B before you judge the argument. If the cell is #NUM!, the seasonality is 1 on a series that cannot show a cycle, or the integer is longer than the history, or the timeline step is uneven. If the cell is #NAME?, you are in Google Sheets.