

LINEST’s five-row block is not slope, then r², then whatever fits
Updated
LINEST(known_y, known_x, calculate_b, verbose) with verbose TRUE spills five rows. For one x column and an intercept, the block is two columns wide. Row 1 is the slope and the intercept. Row 2 is the standard error of each of those coefficients. Row 3 is r², then the standard error of y. Row 4 is the F statistic and the degrees of freedom. Row 5 is the regression sum of squares and the residual sum of squares. None of those rows is labeled. The cell under the slope looks like another fit statistic. It is the uncertainty of the slope. Quoting it as r², or as “the model is 14% confident,” is a misread of a block that calculated successfully.
Extra #N/A cells when there are two x columns are LINEST verbose #N/A. A single predicted y, and a short x range, are FORECAST length. Keep the Google Sheets UI in English. Sheet Error is an independent formula-error library, not a Google product.
Recreate it on a blank sheet
Section titled “Recreate it on a blank sheet”- Open a blank spreadsheet. In A1 type
x, B1y. A21, B22. A32, B34. A43, B45. A54, B57. Four points. They are close to the line y = 1.6x + 0.5 and not exactly on it.
The block. In D1 type linest. Leave D2:E6 empty. In D2 enter =LINEST(B2:B5,A2:A5,TRUE,TRUE). The spill is five rows and two columns.
Row 1, D2:E2, is the slope 1.6 and the intercept 0.5. Exact on this data: slope 8/5, intercept 4.5 - 1.6*2.5.
Row 2, D3:E3, is about 0.1414 and 0.3873. Those are standard errors of the slope and of the intercept. 0.1414 is SQRT(0.02). It is not a second slope and it is not r².
Row 3, D4:E4, is about 0.9846 and 0.3162. D4 is r², exactly 1 - 0.2/13. E4 is the standard error of y, SQRT(0.1), not a second r².
Row 4, D5:E5, is 128 and 2. F statistic, then residual degrees of freedom (4 - 2).
Row 5, D6:E6, is 12.8 and 0.2. Regression sum of squares, then residual sum of squares. 12.8 + 0.2 is 13, the total sum of squares of y around its mean.
No cell in D2:E6 is #N/A. This is a one-x fit with an intercept. Leave the block up.
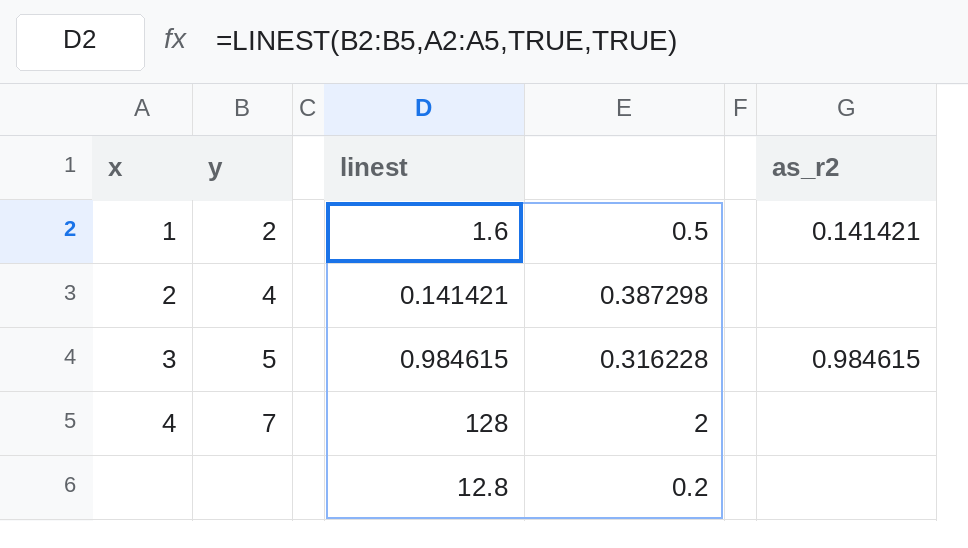
The misread. In G1 type as_r2. In G2 enter =D3. G2 is about 0.141. That is the number people paste into a slide as r² when they move one row down from the slope and assume the stats start there. The r² is D4, about 0.985. In G4 enter =D4. A claim that “the fit explains 14% of the variation” used the slope’s standard error. The residual sum of squares in E6 is 0.2 against a total of 13. The fit is tight. Leave G2 as the wrong quote and G4 as r².
Coefficients only, if you did not want the block. In D8 enter =LINEST(B2:B5,A2:A5). One row: 1.6 and 0.5. No standard errors, no r². If a report needs r², this call did not return it. Do not read E8, which is the intercept, as r² either. Leave D8 as 1.6.
Two x columns pad with #N/A. That wider block still uses row 1 for coefficients and row 3’s first cell for r², and it fills unused stats cells with #N/A. Do not debug those #N/A cells as a failed r². See LINEST verbose #N/A. This page stays on the one-x block, where every cell is a number and the only bug is which number you quote.
Leave D3 unlabeled so it can be mistaken for r². Leave G4 as the real r².
What is actually wrong
Section titled “What is actually wrong”- Verbose TRUE always spills five rows, in a fixed order. Sheets does not write the words “slope” or “r²” into the block. The order above is the labeling.
- Row 2 is uncertainty of the coefficients in row 1, in the same columns. A small standard error under a slope of
1.6supports that slope. It is not itself a percentage of variance explained. - r² is the first cell of row 3 only. The second cell of row 3 is the standard error of the y estimate. Reading E4 as r² is the other common miss. E4 is about
0.316, and r² cannot be recovered by doubling it. - Row 4’s
2is degrees of freedom, not an F statistic and not a second slope. Row 5’s two numbers are sums of squares. Their ratio is related to r² (12.8/13equals D4) and neither number is r² by itself. - Coefficient order with more than one x column is reversed relative to the x range. This sheet has one x, so D2 is that x’s slope and E2 is the intercept. Do not carry “first cell is the intercept” over from another function. The intercept is the last cell of row 1.
This is not a blocked spill. If E3 contained a note, D2 would be #REF! and you would not have a 0.141 to misread. See SORT / UNIQUE spill for the overwrite. Clear the note. Then label the rows.
Leave the five-row spill in D2. Leave G2 as the bad quote.
Label the rows beside the block. In I2 type slope. I3 se. I4 r2. I5 F. I6 ss_reg. In J2 type intercept. J3 se. J4 se_y. J5 df. J6 ss_res. The labels are yours. LINEST will not add them. Read r² from D4, which is 1 - 0.2/13, about 0.9846. Read the slope from D2, 1.6.
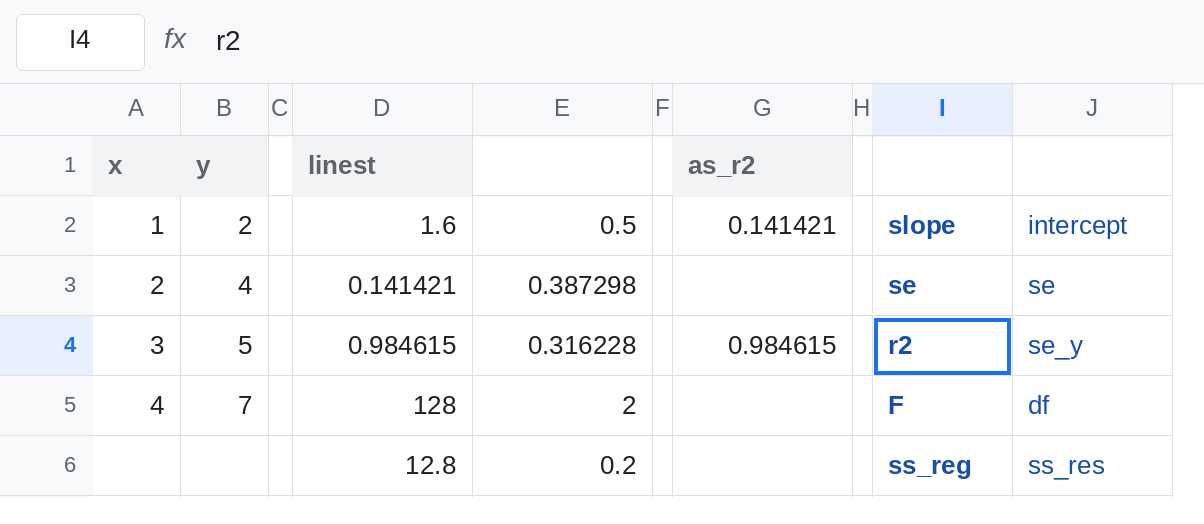
Quote D4, or don’t quote a fit percent. A sentence that needs r² uses =INDEX(LINEST(B2:B5,A2:A5,TRUE,TRUE),3,1). The 3 is the row of r². The 1 is the first column. INDEX of row 2 is the standard error again. Check the index against the labeled block once.
Skip verbose when you only wanted the line. D8 is the slope and the intercept. A forecast at a new x is FORECAST length, not a cell in this block.
If the number under the slope is near 0.14 and r² is being reported as 14%, you are one row too high. r² on this sheet is the first cell of the third row, near 0.98. If a cell in a wider block is #N/A, that is padding, and the r² is still the first cell of row 3 when the fit succeeded.