

SPARKLINE returns #N/A for an illegal charttype or a bad color option
Updated
SPARKLINE(data, options) draws one chart inside one cell. options is a two-column array of names and values. charttype may be line, bar, column, or winloss. area, pie, and banana are #N/A. A misspelled option name, or a color that is not a color, is #N/A even when the numbers are fine. The chart does not fall back to a line and leave a note.
An empty range, and the banana type as a first look, are SPARKLINE empty / args. This page starts from numbers that already plot, then breaks the option array. It is not IMAGE mode and not IMAGE failed to load. Keep the Google Sheets UI in English.
Recreate it on a blank sheet
Section titled “Recreate it on a blank sheet”- Open a blank spreadsheet. In A1 type
n. A23. A31. A44. A51. A65.
Default line. In C1 type line. In C2 enter =SPARKLINE(A2:A6). C2 shows a tiny line. No second argument. That cell is the control.
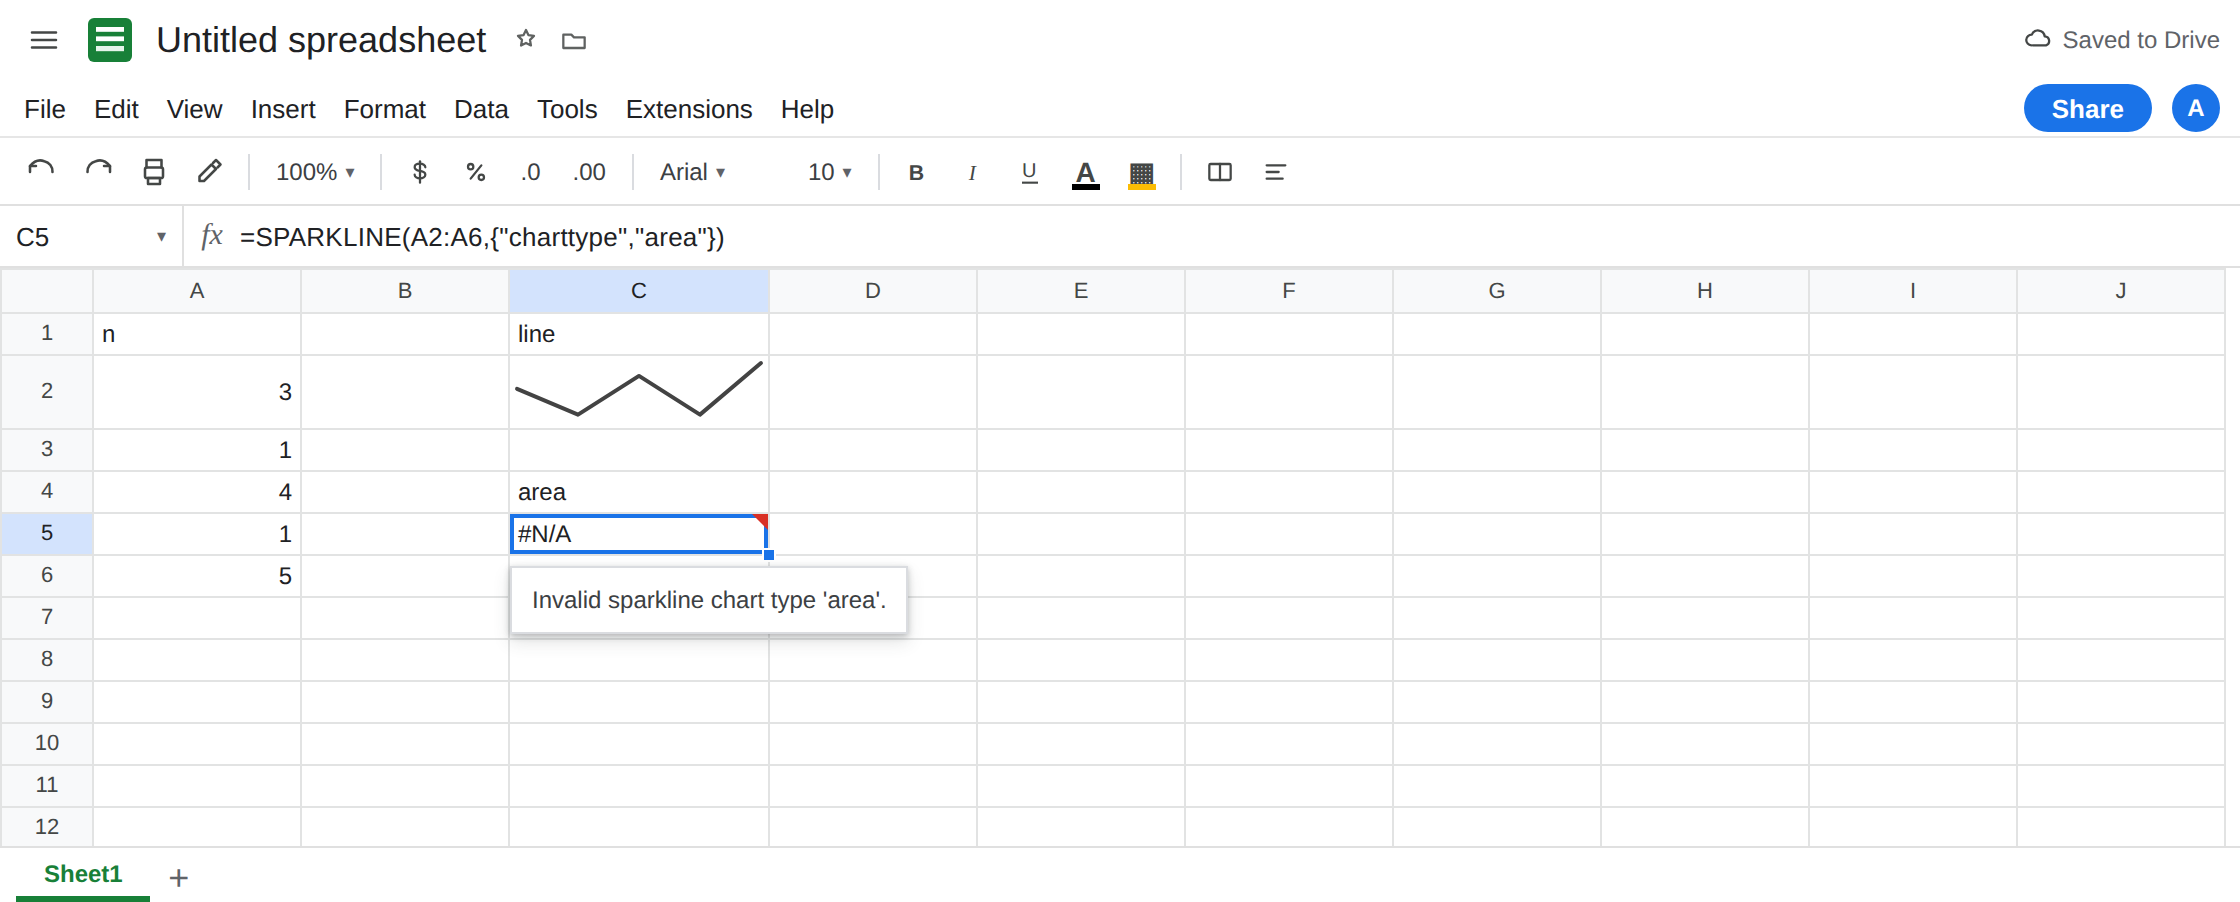
A type that is not in the list. In C4 type area. In C5 enter =SPARKLINE(A2:A6,{"charttype","area"}). The cell shows #N/A. The tooltip is Invalid sparkline chart type ‘area’. area is a chart type in the Chart editor. It is not a sparkline type. Leave C5 broken.
Column is legal. In C7 enter =SPARKLINE(A2:A6,{"charttype","column"}). C7 shows columns. bar, column, and winloss are the other legal types. winloss plots the sign of each value, not the magnitude. It is still a legal charttype. Leave C7 as the second control.
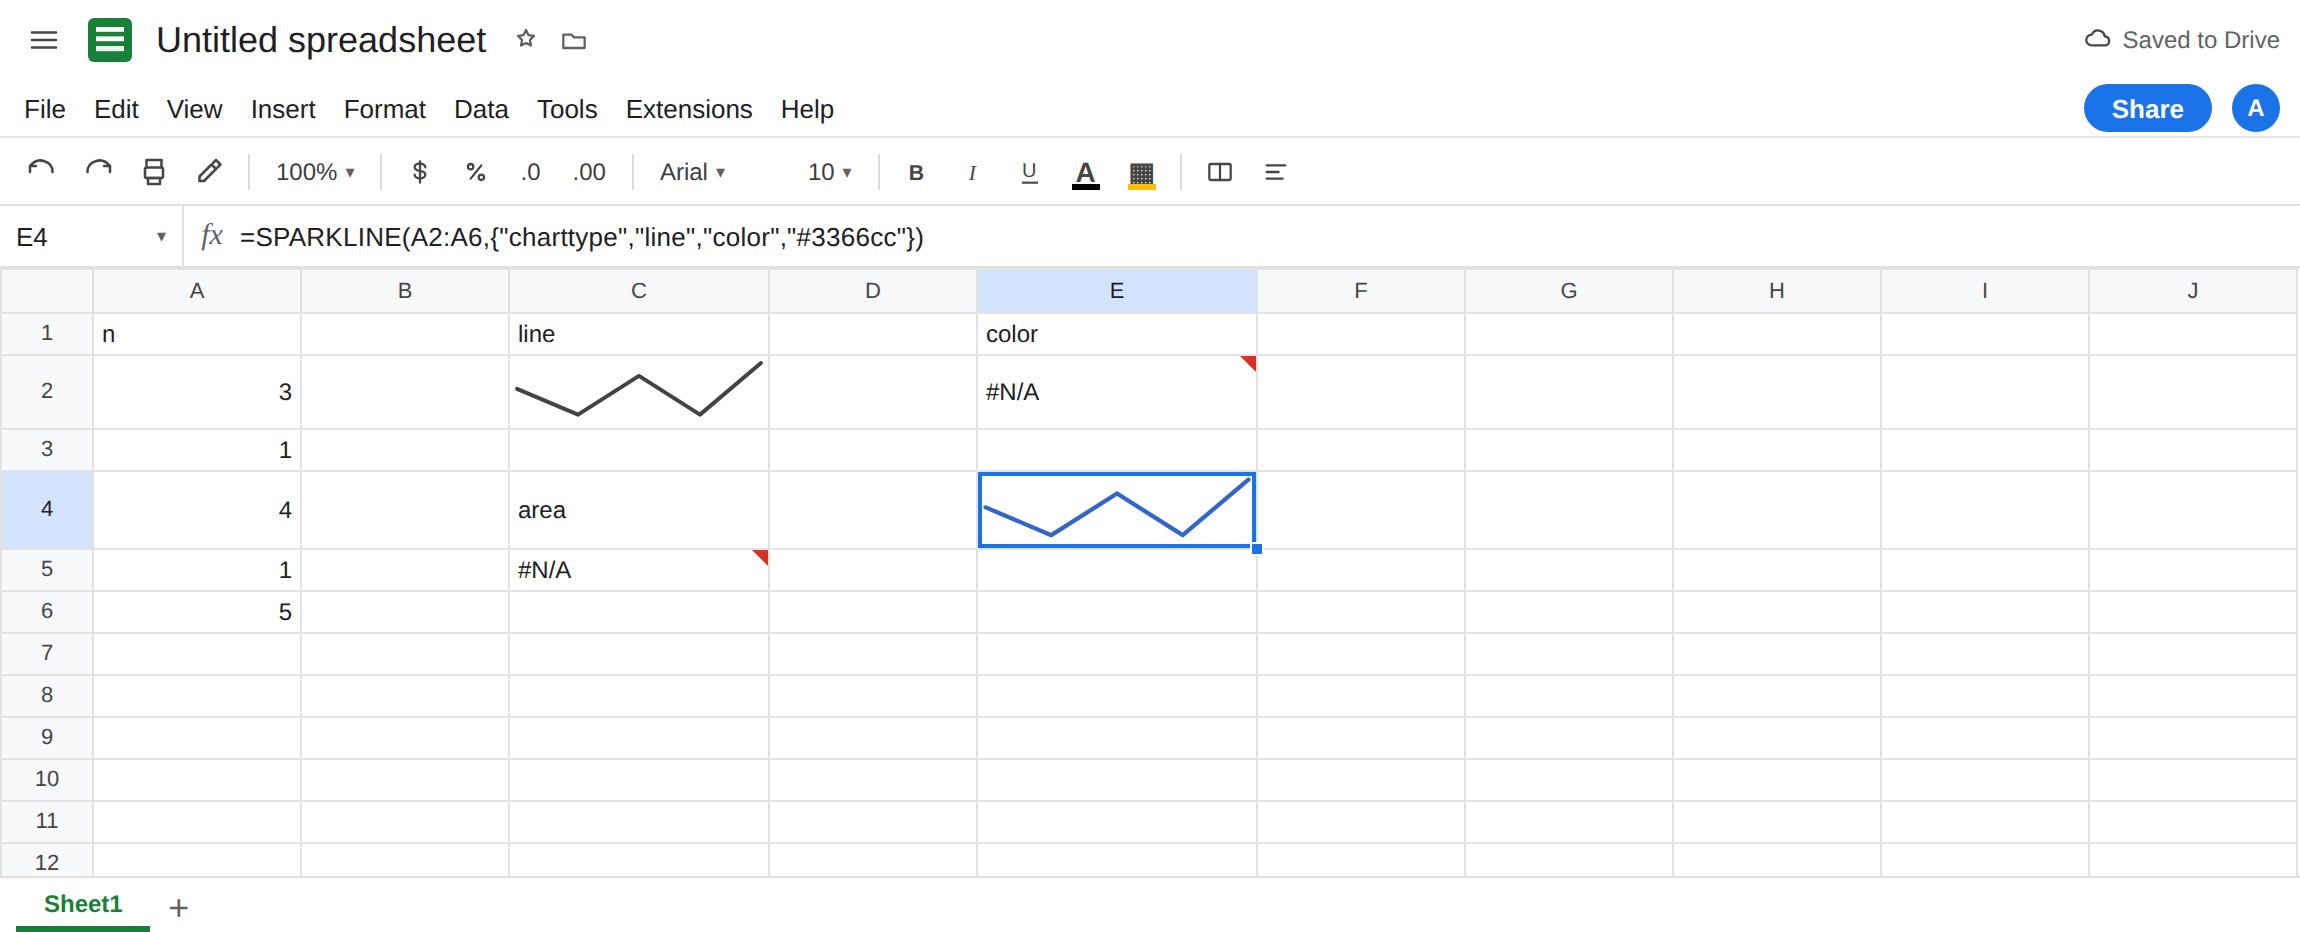
Misspelled option. In E1 type color. In E2 enter =SPARKLINE(A2:A6,{"charttype","line","colour","#3366cc"}). colour is not an option name. The cell shows #N/A (unknown option). American spelling color is the name, even when the spreadsheet locale is United Kingdom. Leave E2 broken. In E4 enter =SPARKLINE(A2:A6,{"charttype","line","color","#3366cc"}). E4 shows a blue line. That is the color control.
A color that is not a color. In E6 enter =SPARKLINE(A2:A6,{"charttype","line","color","notacolor"}). #N/A. red and #3366cc are colors. notacolor is not. Leave E6 broken.
Options must be pairs. In E8 enter =SPARKLINE(A2:A6,{"charttype"}). One element, no value. The cell errors. In E10 enter =SPARKLINE(A2:A6,"column"). A bare string is not an option array. The cell errors. Leave both broken. The legal shape is name, value, name, value.
ymin above ymax. In G2 enter =SPARKLINE(A2:A6,{"ymin",10,"ymax",0}). The scale is upside down. The cell shows #N/A or an empty-looking chart that is not the C2 line. If it errors, leave it. If it draws nothing useful, treat that as a bad scale, not as proof that charttype failed. C5 is the type error. G2 is the scale.
If { is #ERROR! Formula parse error, this locale’s array column separator is a backslash. Write {"charttype"\"column"}. See array literal locale. That parse error is not an invalid chart type.
Leave C5, E2, and E6 broken. Leave C2 and C7 drawing.
What is actually wrong
Section titled “What is actually wrong”charttypeis a closed list:line(the default),bar,column,winloss. Chart-editor names (area,pie,scatter,combo) are not accepted. The tooltip quotes the bad type. C5.- Option names are exact.
color,linewidth(line),ymin,ymax,xmin,xmax,empty,nan,rtl, and the win/loss colorscolor/ low color options such asnegcolorwhere the type supports them.colour,colorr, andtypeare unknown. Unknown name is#N/Aeven when the chart type isline. - Values have types.
colorwants a CSS color (red,#3366cc).linewidthwants a number.charttypewants one of the four words. Pairing"color"with"column"is a color value, not a type. Pairing"charttype"with"#3366cc"is an invalid type. - The options array is two columns. A single string, or a one-element array, never becomes
charttype. Build it with{name, value}or with a two-column range on the sheet. - Empty data is still the other page.
=SPARKLINE(A8:A10)on blank cells is#N/Abecause there is nothing to plot, and the tooltip talks about numeric data, not about chart type. See SPARKLINE empty / args.
This is not IMAGE. A sparkline has no URL. See IMAGE failed to load.
Leave C5 and E2 broken.
Stay on the four types. Keep C2 for the default line. Keep C7 for columns. =SPARKLINE(A2:A6,{"charttype","bar"}) and {"charttype","winloss"} are the other two. Do not pass area.
Spell color in the option name, and pass a real color. Keep E4: {"charttype","line","color","#3366cc"}. Add "linewidth",2 in the same array if the line should be heavier: {"charttype","line","color","#3366cc","linewidth",2}.
Do not wrap C5 in IFNA. You would hide an illegal type and show a blank cell that looks like “no sales.” See IFERROR vs IFNA. If the range might be empty, guard with COUNT as the empty-range page describes. That guard is for blanks, not for area.
If the tooltip quotes the chart type, replace it with line, bar, column, or winloss. If the tooltip names an option, the name is not on the list or the value is the wrong kind. C2, with no options at all, is the chart that proves the numbers were never the problem.