

FORECAST returns #N/A when the x and y ranges differ in length
Updated
FORECAST(x, data_y, data_x) predicts a y for the x you pass, using a straight line through the points you already have. data_y and data_x must contain the same number of numeric points. A y range of three cells and an x range of two cells is #N/A. The line never gets built. FORECAST.LINEAR is the same function. A matched range on a perfect line returns a number with no triangle. Text in either range is ignored, so a label left inside the numbers can also make the numeric lengths disagree.
The full regression block, including padded #N/A cells, is LINEST verbose. Keep the Google Sheets UI in English. Sheet Error is an independent formula-error library, not a Google product.
Recreate it on a blank sheet
Section titled “Recreate it on a blank sheet”- Open a blank spreadsheet. In A1 type
x, B1y. A21, B22. A32, B34. A43, B46. Three points on the line y = 2x.
A forecast that works. In D1 type ok. In D2 enter =FORECAST(4,B2:B4,A2:A4). The new x is 4. Known y is B2:B4. Known x is A2:A4. D2 is 8. Three y values, three x values. =FORECAST.LINEAR(4,B2:B4,A2:A4) is also 8. That cell is the control.
Shorter x range. In D4 type short_x. In D5 enter =FORECAST(4,B2:B4,A2:A3). Three y values, two x values. The cell shows #N/A. The lengths do not pair: Sheets cannot tell which y belongs to which x once the counts differ. Leave D5 broken. The points in A2:B4 are still a perfect line. The forecast failed because the formula does not use A4.
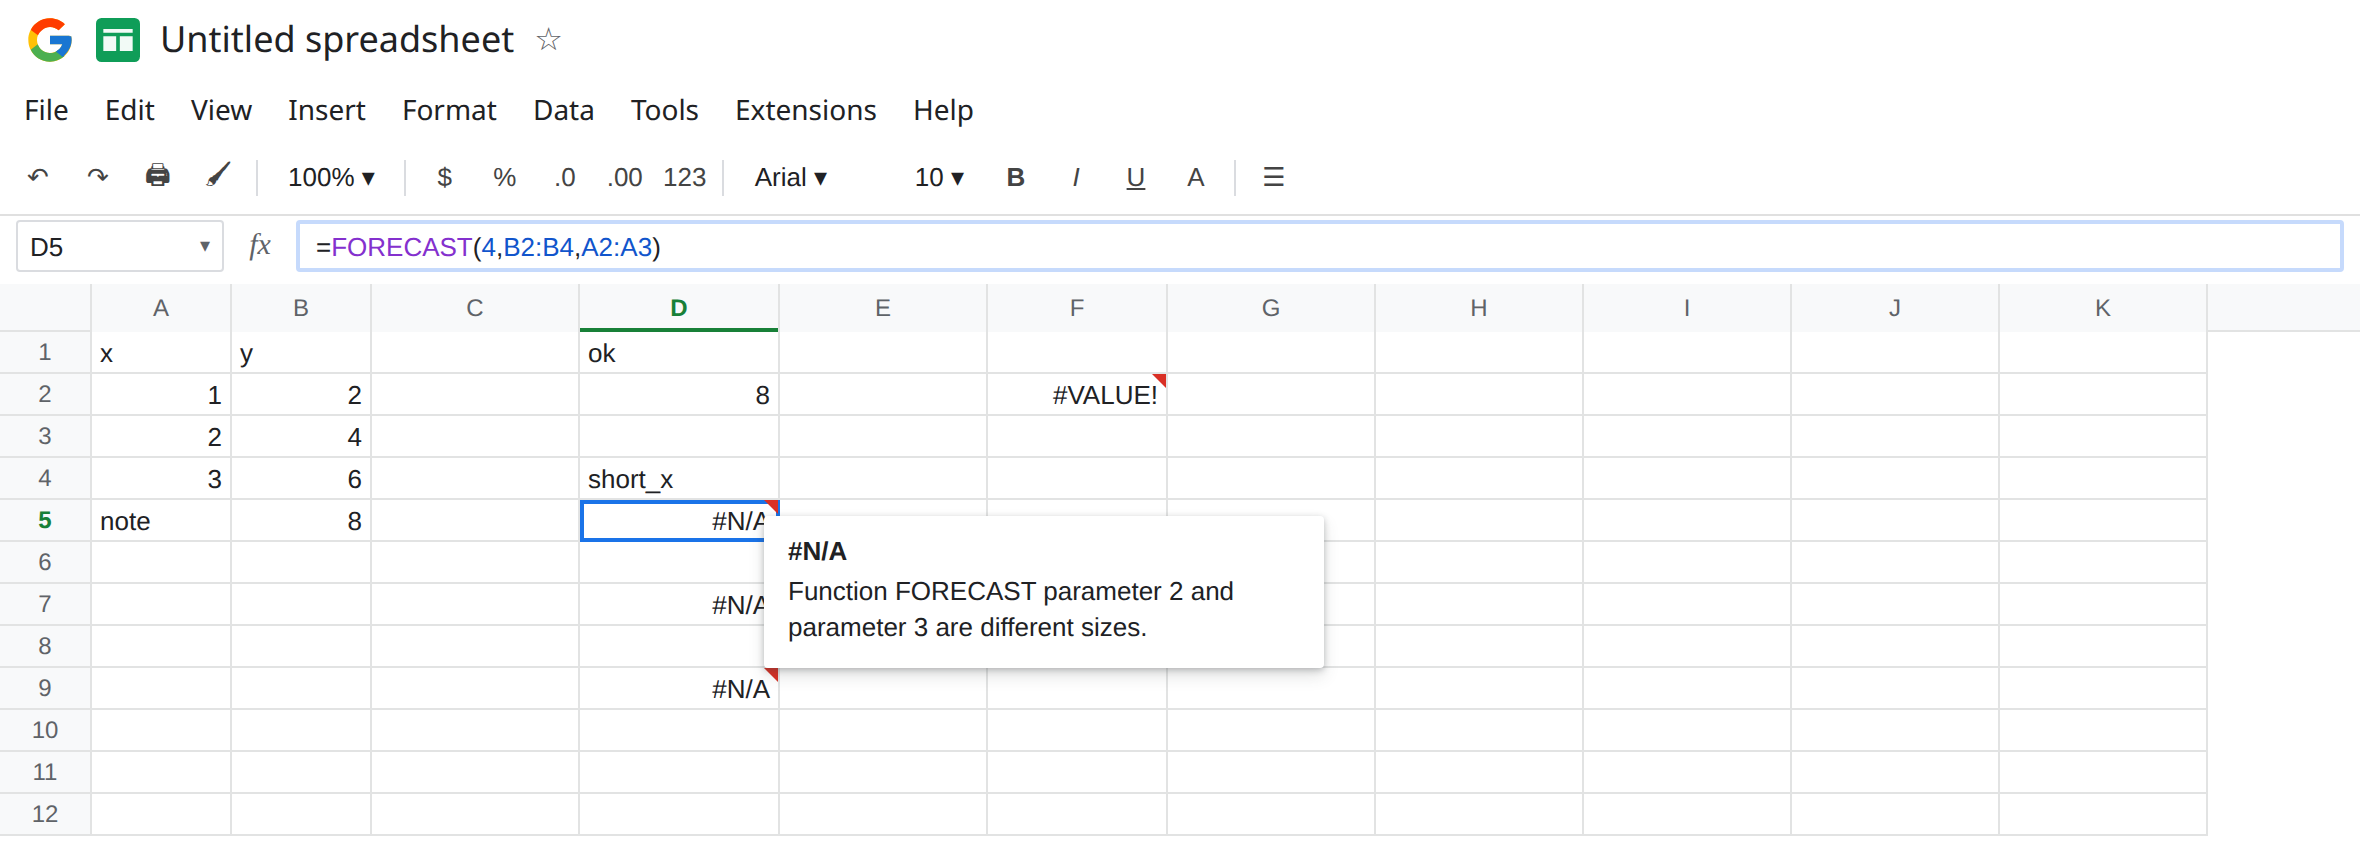
Shorter y range. In D7 enter =FORECAST(4,B2:B3,A2:A4). Two y values, three x values. #N/A again. Leave D7 broken. Either side can be the short one.
A label inside the range. In A5 type note and in B5 type 8, as if someone started a new point in the wrong columns. In D9 enter =FORECAST(4,B2:B5,A2:A5). The ranges are both four cells, but A5 is text. Text is ignored. The numeric x values are still three (1, 2, 3) and the numeric y values are four (2, 4, 6, 8). The counts of numbers disagree. D9 is #N/A. The ranges look the same height on the grid. The numbers do not. Leave D9 broken. This is the size bug wearing a label.
x that is text. In F2 enter =FORECAST("soon",B2:B4,A2:A4). The known ranges match. The x you asked to forecast is not a number. The cell shows #VALUE!. That is wrong type, not D5. Leave F2 as #VALUE! so the two errors sit apart.
Leave D5, D7, and D9 as #N/A. Leave D2 as 8.
What is actually wrong
Section titled “What is actually wrong”- Pairing is by count of numeric points, not by “these two rectangles look related.” Three and two is
#N/A. A text cell that drops out of only one side is also#N/A(D9) even though A2:A5 and B2:B5 are both four rows. - The first argument is the x you want, not another range.
FORECASTreturns one number. It does not spill a column of predictions. A blocked neighbor is not the bug on this page. D5 is#N/Ain a single cell. - Order is
(x, data_y, data_x). Swapping y and x builds a different line (predicting x from y) and can still return a number. If D2 were not8, check the argument order before you call it a size error. On this sheet, swapping them isFORECAST(4,A2:A4,B2:B4), which forecasts an x-scale value from y-scale data and will not be8. - A vertical line — every known x identical — cannot define a slope. That failure is
#DIV/0!or#N/Adepending on the points, and it is not D5. D5’s x values1and2are fine. The third point was simply left out of the formula. FORECAST.LINEARtakes the same arguments and the same length rule. Renaming the function does not accept a short range.
This is not LINEST’s padded #N/A inside a statistics block that succeeded. See LINEST verbose. D5 never produced a slope.
This is not FILTER range size. See FILTER range size. Different function, and D2’s success shows the points themselves are numeric.
Leave D5, D7, and D9 broken.
Point both ranges at the same rows. Keep D2: =FORECAST(4,B2:B4,A2:A4). If the table grows, grow both sides: B2:B10 with A2:A10, not B2:B10 with A2:A4.
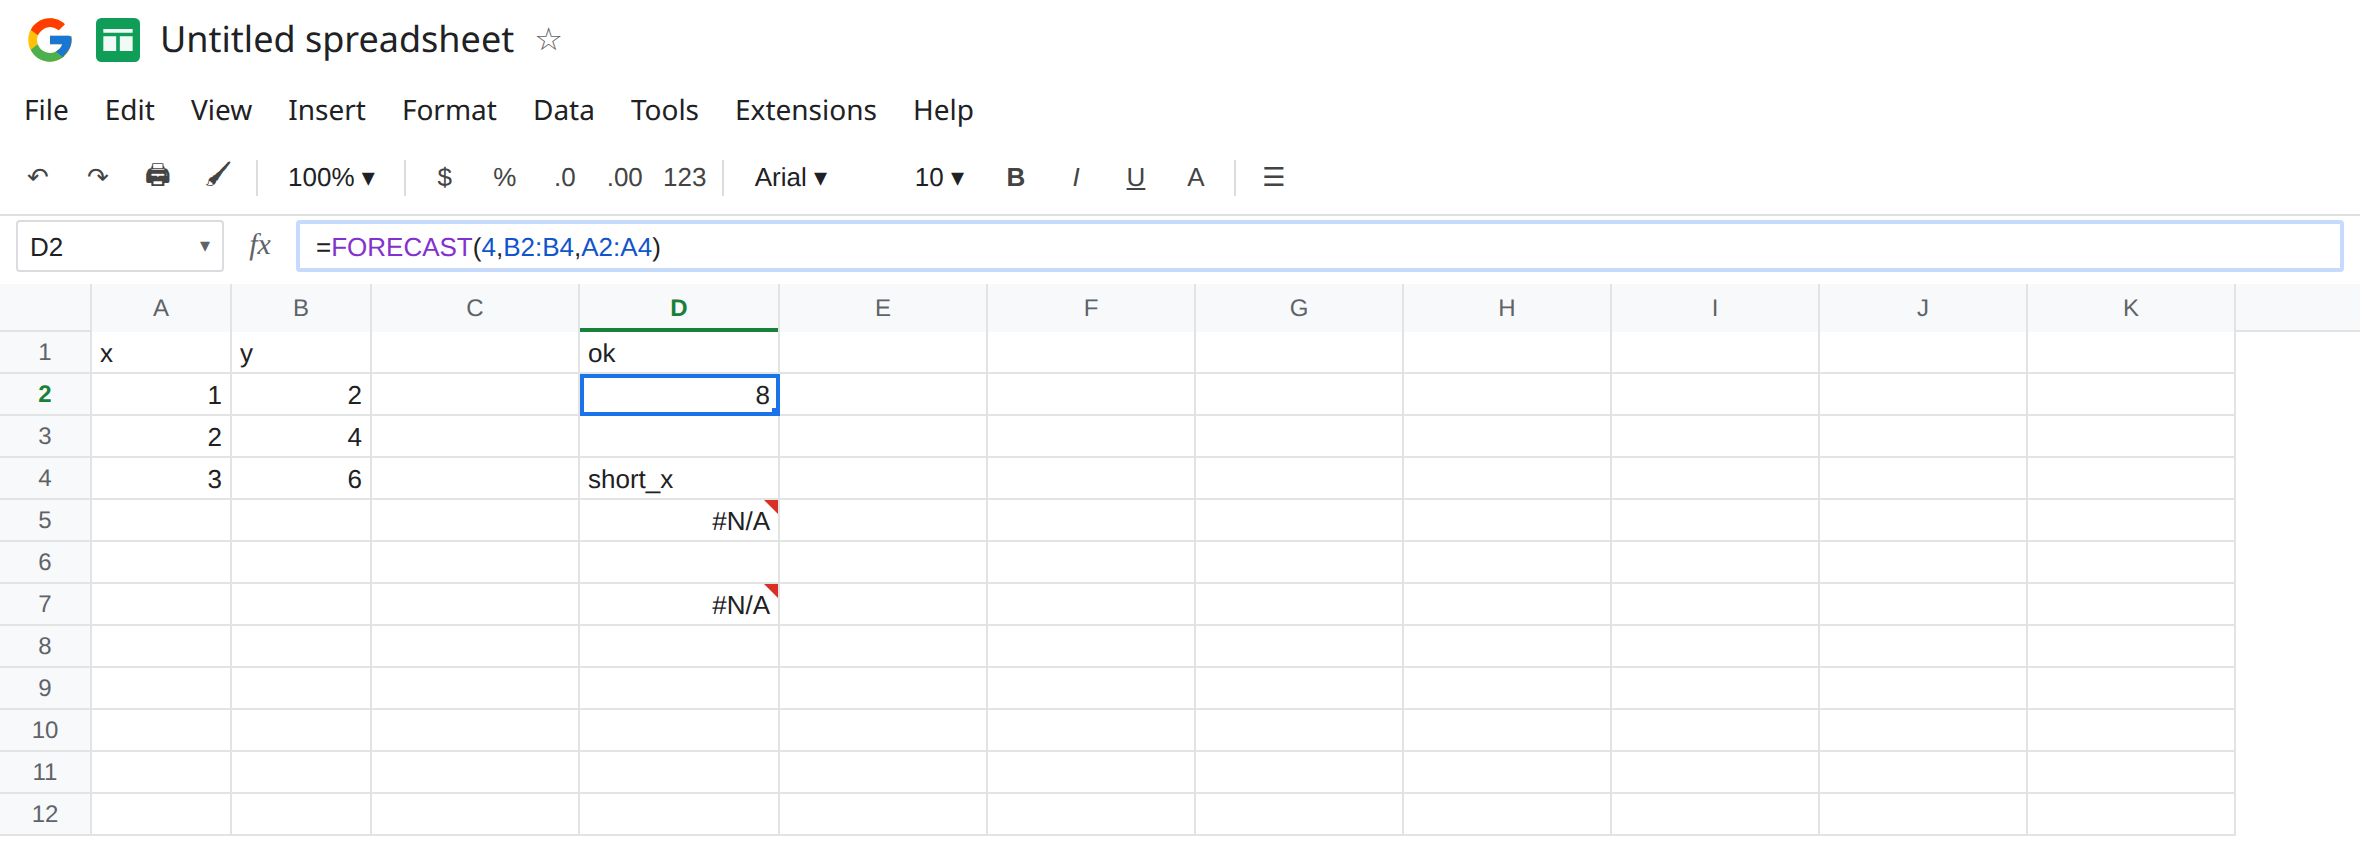
Take the label out of the numeric block. D9 includes A5 and B5. Stop at row 4, or move note off the data columns. Do not leave text in one column of a paired range.
Forecast a number. F2 needs a numeric x. 4 works. A date serial is a number and is legal if the known x values are dates too. The word soon is not.
Do not wrap D5 in IFNA and show 0. A missing point is not a forecast of zero. See IFERROR vs IFNA. IFNA would hide D5 and would also hide a real “no line” result you still need to see.
If FORECAST is #N/A, count numeric cells in data_y and in data_x, not painted rows. If it is #VALUE!, the x you passed is text (F2). If the number is not the one you can draw with a ruler, check that y is the second argument and x is the third. On this sheet the matched call is 8.
Length vs a matched line
Section titled “Length vs a matched line”D2 is 8 from three points and a new x of 4. D5 and D7 are #N/A because one range is a row short. D9 is #N/A because text removed a point from only one side. F2 is #VALUE! because "soon" is not an x. LINEST on B2:B4 and A2:A4 is the slope and intercept behind D2, and its extra #N/A cells are a different page.